一、什么是webhook

1. webhook简介

用过Jenkins自动化构建项目的流程都知道,当git push之后,git的webhook机制便会发出请求,向Jenkins服务器通知开始执行构建流程。 Webhooks可以理解为满足特定的事件触发时(例如git push代码后,或者grafana触发告警),源网站发起一个HTTP请求到webhook配置的URL。webhook收到请求后进行相对应的处理(比如Jenkins自动构建项目,或者转发grafana告警)。 概括来说,就是在一个系统触发事件后,另一个系统收到请求并处理相应的任务,而收到请求并处理的部分便是webhook

2.grafana使用webhook场景

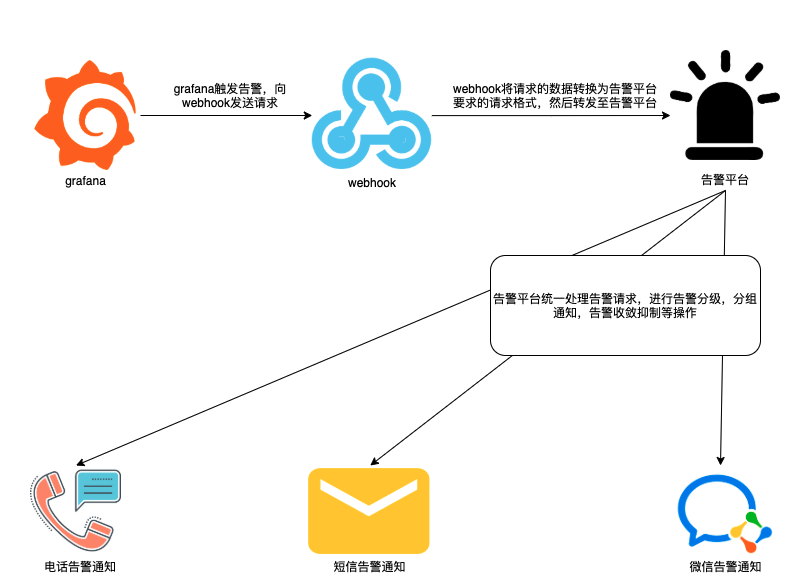
虽然grafana内置了非常丰富的告警媒介(例如邮箱、钉钉、slack、Prometheus Alertmanager等)具体参考官方文档:https://grafana.com/docs/grafana/latest/alerting/notifications/。 但是如果需求是收到grafana告警后执行一系列的其他操作,此时内置的告警媒介便不能满足需求,例如在企业内部已有告警平台接口,实现了告警分级通知,分组通知等功能。但是grafana告警事件与现有的告警平台接口并不能直接对接,因为grafana告警输出格式与告警平台接入格式并不匹配。此时就要用到webhook充当中间人角色,收到grafana告警内容后做一系列处理工作,转换为告警接口要求的请求格式,从而实现告警触发。 ![image.png](https://cdn.nlark.com/yuque/0/2021/png/2308212/1622474210316-8b4435c2-44a7-40af-b75c-07d8742ea9f4.png#align=left&display=inline&height=587&margin=[object Object]&name=image.png&originHeight=587&originWidth=791&size=74760&status=done&style=none&width=791)
二、webhook程序编写

1. 需求分析

webhook程序功能很简单,就是运行一个监听端口的服务。当webhook收到grafana的请求后,获取到request的body内容,进行一系列的处理后,返回给grafana一个正常的response。

2. 示例程序

此处使用python的flask框架开启一个webhook服务为例

from flask import Flask, request
from log import logger

app = Flask(__name__)

@app.route('/', methods=["POST"])
def index():
    req = request.json
    print(req)
    return 'success!'

if __name__ == '__main__':
    app.run(debug=True)

三、webhook配置

1. 点击添加告警通知
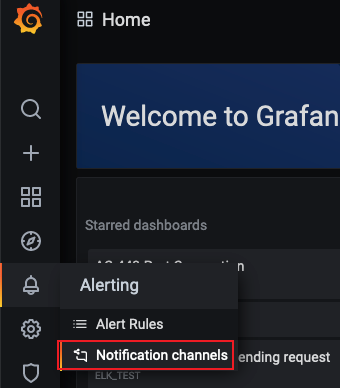
![image.png](https://cdn.nlark.com/yuque/0/2021/png/2308212/1622549432968-2d496f82-695b-47ac-8d8a-16210a98c968.png#align=left&display=inline&height=388&margin=[object Object]&name=image.png&originHeight=388&originWidth=340&size=28668&status=done&style=none&width=340)

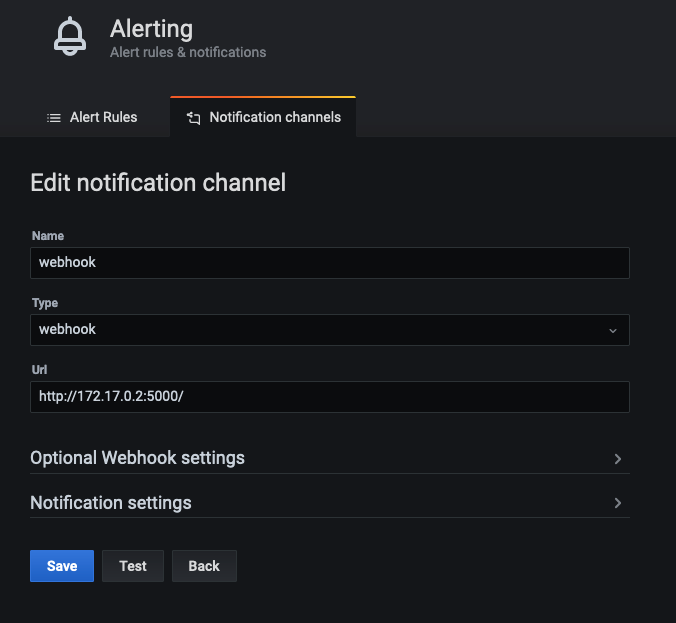
2. 添加webhook通知配置

![image.png](https://cdn.nlark.com/yuque/0/2021/png/2308212/1622549651111-69a55f5e-4a44-42f0-8ca1-c372b47f0970.png#align=left&display=inline&height=623&margin=[object Object]&name=image.png&originHeight=623&originWidth=676&size=37879&status=done&style=none&width=676)

3. 点击test发送测试告警,查看flask程序控制台是否打印请求内容

![image.png](https://cdn.nlark.com/yuque/0/2021/png/2308212/1622549865919-9cadc741-14c3-405d-9442-6bd02da72cb6.png#align=left&display=inline&height=106&margin=[object Object]&name=image.png&originHeight=212&originWidth=1605&size=40044&status=done&style=none&width=802.5)

四、grafana告警配置

grafana暂只支持对graph类型图表添加告警

1. 进⼊编辑模式后,选择 Alert 选项卡,创建告警
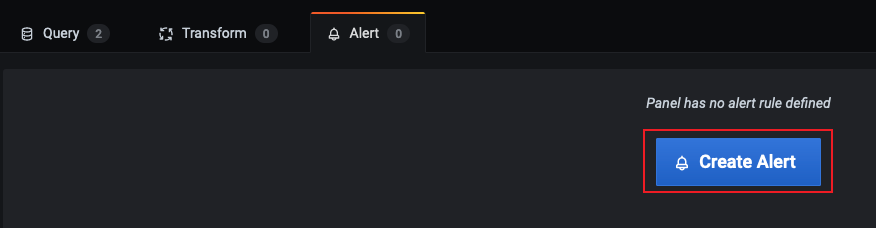
![image.png](https://cdn.nlark.com/yuque/0/2021/png/2308212/1622550484615-141dcb17-b96a-46b5-b363-d10dc90c371b.png#align=left&display=inline&height=228&margin=[object Object]&name=image.png&originHeight=228&originWidth=876&size=15738&status=done&style=none&width=876)

2. 设置告警规则

![image.png](https://cdn.nlark.com/yuque/0/2021/png/2308212/1622550546114-3ff93ed9-ca24-45d8-984f-bf7c0b413076.png#align=left&display=inline&height=68&margin=[object Object]&name=image.png&originHeight=68&originWidth=872&size=7494&status=done&style=none&width=872)

  • name:告警名称
  • evaluate every:告警检测时间间隔(可填写s、m、h,例如: 30s, 3m, 5m or 1h)
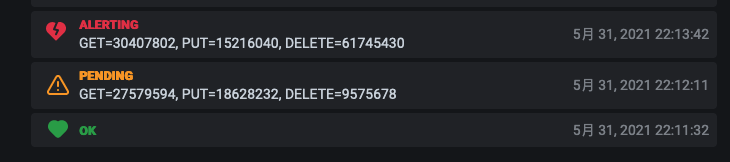
  • for:在触发告警前,需要查询多长时间的间隔(当告警满足触发条件,不会立即告警,而是先转为peding,一旦超过for设置的时长,再转为alerting状态)
![image.png](https://cdn.nlark.com/yuque/0/2021/png/2308212/1622470448335-ce03b43d-163a-4bb1-8151-68fa6ab361b2.png#align=left&display=inline&height=162&margin=[object Object]&name=image.png&originHeight=162&originWidth=730&size=18761&status=done&style=none&width=730)

3. 设置graph监控的阈值

    ![image.png](https://cdn.nlark.com/yuque/0/2020/png/2308212/1607768836142-97bb0c95-9a4d-457b-9617-5fa2ca994b79.png#align=left&display=inline&height=141&margin=[object Object]&name=image.png&originHeight=141&originWidth=761&size=11770&status=done&style=none&width=761)

  • when:聚合操作类型(可以是 avg、max、min、last等)
  • of:查询公式Query(A,5m,now)。其中的A是Graph曲线编号,5m表示取开始时间区间,now表示结束时间区间。也可以是(1h,now-50m)
  • IS ABOVE:报警的触发阈值了,当⼤于80的时候 就会发出报警

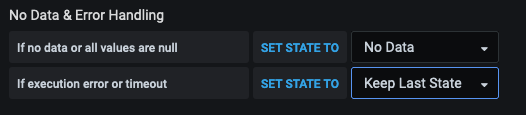
4. 无数据和错误处理
![image.png](https://cdn.nlark.com/yuque/0/2021/png/2308212/1622468536115-a401069e-4241-43c8-945f-d1bc684704bc.png#align=left&display=inline&height=115&margin=[object Object]&name=image.png&originHeight=115&originWidth=526&size=13011&status=done&style=none&width=526)

  • If no data or all values are null:如果没有数据或所有值都为空
  • If execution error or timeout:如果执行错误或超时
选项介绍
No Data将警报规则状态设置为无数据
Alerting将警报规则状态设置为警报
Keep Last State保持当前的警报规则状态。
Ok将警报规则状态设置为正常

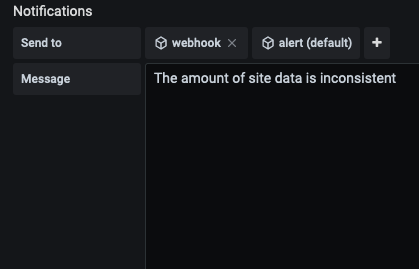
5. 设置报警媒介与内容

    ![image.png](https://cdn.nlark.com/yuque/0/2021/png/2308212/1622551010237-cc22f4df-e1ba-4abb-99c4-8b887486b8d4.png#align=left&display=inline&height=269&margin=[object Object]&name=image.png&originHeight=269&originWidth=419&size=12427&status=done&style=none&width=419)

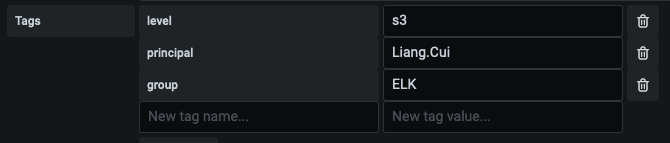
6. tag设置

![image.png](https://cdn.nlark.com/yuque/0/2021/png/2308212/1622552060253-ea943565-61dc-4d26-a823-ff7940bcc462.png#align=left&display=inline&height=143&margin=[object Object]&name=image.png&originHeight=143&originWidth=670&size=11323&status=done&style=none&width=670)

  • tag的用途是可以添加一些自定义的key:value。目前支持自定义tag类型为:Prometheus Alertmanager、Webhook
  • tag可以配合alertmanager,实现基于标签的告警处理。实现根据告警等级,告警组匹配规则,进行不同的处理。

7. 查看报警信息

  • 调整告警阈值,模拟生成告警内容,查看webhook请求信息
{
    'dashboardId': 370, 
    'evalMatches': 
    [
        {
            'value': 78020189,
            'metric': 'GET', 
            'tags': {'metricId': '1'}
        }
    ], 
    'message': 'REPORT-ELK The amount of site data is inconsistent', 
    'orgId': 1, 
    'panelId': 40, 
    'ruleId': 70, 
    'ruleName': 'Data Imbalance Alert', 
    'ruleUrl': 'http://localhost:3000/d/DLPzu2-Gk/all_alert?tab=alert&viewPanel=40&orgId=1', 
    'state': 'alerting', 
    'tags': 
    {
        'level': 's3',
        'principal': 'Liang.Cui',
        'group': 'ELK'
    }, 
    'title': '[Alerting] Data Imbalance Alert'
}

至此,一个简单的webhook基本功能就实现了。接下来根据实际的业务需求,编写相关的逻辑代码即可。